Reticle Haze Process Control using Weir PW
Sections (Links to 3 chapters)
1. Reticle-Haze sources, behavior and influence
2. Detection of reticle haze .
Table of Contents
Validation of Dose Uniformity Method
Detection of Reticle Haze
Reticle Haze is the formation of chemical residue that can be symmetric around the edges of a reticle or asymmetric forming from a single edge.
-
Radial-oriented signatures are typically exposure or process induced formations.
-
Reticle cleaning operations tend to form edge-preferred orientations
-
Equipment sources from contamination or damage to the reticle can initiate haze at random, scatter locations that cover a wide range of the plate's surface.
Testing for haze therefore does
not require an inspection of the entire plate. A sampled inspection of a regular
array of points across the exposure field will detect any form of reticle haze.
Haze will influence the across-reticle distributions of CD uniformity,
Depth-of-Focus, IsoFocal Dose and Exposure-Dose uniformity. Of these variables,
the Exposure-Dose needed to achieve a target-CD value will be the most sensitive
indicator of early haze formation. Monitoring IsoFocal Dose characteristics
for every site will also exhibit early haze sensitivity.
The presence of Haze over any reticle feature-site can be seen through a Bossung analysis of the data as shown in the image on the right. As the exposure-dose moves away from the IsoFocal dose, curve "A", the influence of the exposure tool's focus setting has an increased influence on feature size. Feature size is minimized at the 2nd order extremity of each dose-curve, shown here as the "Best Focus" Curve.
An ideal exposure tool lens without aberrations will exhibit a linear "Best Focus" curve that is linear and orthogonal to the abscissa. That is, the response of best focus is unchanging with dose.
The presence of aberrations in the lens systems forces asymmetric response of the dose curves about the best focus point with a concurrent bending of the Best Focus response curve.

Weir PW performs a Bossung Analysis on every site located on the reticle field. Sites whose response curves are influenced by haze will quickly degrade feature profiles. The figure shown on the right exhibits the feature profile edge-slope variation with dose as measured on an OCD tool. In this dataset the reticle was subjected to a radial haze formation as shown on the inset. Profile-slope curves for four reticle sites, shown as sites "A thru "D", are then plotted.
Notice how the haze-influenced sites, A & D, lose response sensitivity and cannot achieve the higher slope values while the field-center slopes are not strongly influenced.
The strong influence of reticle
haze on the aberrations of the lens system of the exposure tools provides an
opportunity to detect the presence of reticle haze very early in the deposition
cycle. To detect reticle haze, expose the product reticle is using a Focus-Dose
matrix (FEM) setup in the same format as one used for a classic "Process Window"
analysis. The metrology differs from the classic analysis in that more than one
site is measured on the exposure field. The sites measured should include a
regular area covering as much area of the reticle as possible particularly
around the edges with at least one site near the center of the exposure field.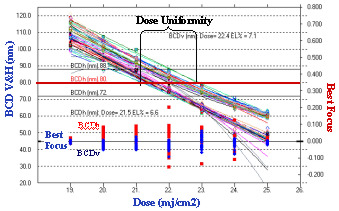
A Weir PW analysis of the FEM data will yield the dose uniformity by calculating a Bossung-curve analysis of the response of each site to focus and dose as shown in the figure on the right. The feature size, in this case Bottom Critical Dimension (BCD) values for Vertical and Horizontal oriented features, are plotted against the Exposure-Dose. This curve differs from a common Bossung Analysis in that the across-field focus errors must be removed from the data to yield a more accurate analysis of reticle-to-wafer response.
The data points marked "Best Focus" on the bottom of the graph illustrate the optimal focus for each site at the exposure dose and their values are plotted against the ordinate axis on the right side of the graph. Weir PW then saves a Dose Report in the data workbook that details the calculated Dose, Focus and Exposure Latitude that will be experienced by each site when the feature is at the target feature size at each process.
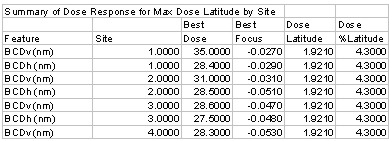
The target feature size can be
either the process specification or the projected feature size at the IsoFocal
Dose. Any of these variables can be graphically viewed, using Weir PW, as
contour or 3 Dimensional surfaces or as box-plots, X-Y graphic plots verses
position or as a simple histogram.
Dose Uniformity Contour with/ without Haze
The contour plot of dose uniformity shown on the right illustrates a reticle dose response after haze has formed on the reticle (left contour) and after reticle cleaning (right image). The image illustrates the dose-energy that must be exposed on each portion of the reticle in order to achieve an on-target feature size.
The haze-free reticle image on the right shows an exposure that has a brighter center-scan than the field edges. The field edges therefore would require a higher dose, as shown, to achieve target feature size. The response of the haze-free reticle on the right is typical for a scanner and the loss of exposure on the left and right sides of the reticle are an artifact of the intensity profile of the scanner lens-slit. The vertical uniformity of the exposure is an artifact of the scan of the slit up or down the field by the reticle-stage during exposure.
This is a highly accurate illustration of the reticle-response since focus errors of the exposure-tool have been removed from the analysis. A small amount of haze formation on the reticle will change the required exposure-dose. The hazed-reticle image on the left contour has been obtained from a reticle-cleaning system that has deposited haze across the center of the plate requiring an average increase of 2.6 mj/cm2 exposure to achieve final image size.
Validation of Dose Uniformity Method
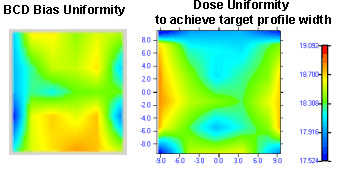
A recent study reported the results of the direct measurement of reticle feature sizes using an optical ellipsometer (OCD) tool1. The natural feature-bias taken at the IsoFocal Dose point was calculated by subtracting the size of each feature's measurement on the reticle from the Bottom Critical Dimension (BCD) value measured on a wafer exposed in a focus-dose matrix.
The feature bias contour plot is shown on the left-side of this figure. This is the bias variation across the exposed field at the IsoFocal Dose. Bias is directly related to the Mask Error Function, so it also varies across the exposure field as a function of feature construction and tool aberrations.
The contour plot on the right side of the figure is the calculated dose-uniformity needed to achieve a 70 nanometer (nm) target size on the same exposure tool. This data was taken three months earlier using the same reticle but without knowledge of the reticle feature-size measurements. The sites measured on each are not the exact same sites but the reticles and exposure-tool were identical.
The Bias Uniformity is shown here to be a highly correlated and inversely related to the Dose Uniformity plot. That is, a high-Bias point on the reticle field correlates to a low-Dose uniformity as we would expect from the definition of each plot. This correlation is greater than 87% and presents independent confirmation of the Dose Uniformity calculation method.
Test Wafer and Metrology Layout
The exposures on the test wafer should be performed using the same layout and recipe used for a Process Window analysis. Expose a focus-dose matrix of fields that cover the depth-of-focus and exposure latitude of the tool and process.
Metrology on the wafer can be performed using any metrology tool. An OCD tool is more effective since the area measured by the tool averages over the 50 micron square area of the target CD. CD-SEM data will also work.
Unlike a process-window analysis,
more than one site per exposure field must be measured in order to insure
measurement in any area of the reticle susceptible to haze formation. We
recommended a minimum of nine sites on the reticle, more measurements will add
metrology time but they also increase accuracy and the probability of early haze
detection. Ideally the analysis should measure a 3 x 3 array to do this with
sites positioned on each exposure field where the 3x3 is uniformly setup across
the whole exposure similar to:
x x x
x x x
x x x
- Do not set all measurement sites around the edges or just in one corner.
- Exact placement is not critical but the metrology should sample near the field center and on the edges.
- If you only measure one site on the reticle you cannot model dose
uniformity across the whole area.
- If you only measure the edges then you may miss haze that occurs on the center only of the reticle.
- If you only measure one corner, then you cannot assume the other corners
will also respond the same.
If we have these points on the reticle, then the Weir Software model can
accurately tell you if haze occurs between the points by using the model.
As the number of measurement sites increase, the confidence level in finding
haze earlier in the cycle will increase. Even with only four points measured on
the corners, this method will find haze before direct-inspection,
light-scattering methods on the reticle because you are directly measuring the
reticle features.
Influence of Sample-Size on Dose-Mapping Accuracy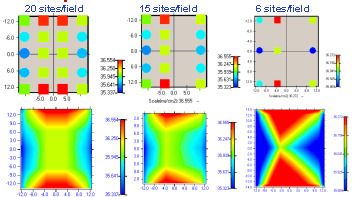
The influence of sample-size is graphically shown in the figure on the right. This is a reticle exhibiting haze formation on the top and bottom edges from cleaning depositions.
The left-plot shows the measurement location of 20 measured sites on the field with the corresponding dose-uniformity contour directly below it.
The center plots have reduced and offset the metrology sites. Even with only nine points measured on the exposure field, dose nonuniformity is clearly seen.
Detection of Reticle Haze Summary
Reticle haze is an area phenomenon that initiates deposition in high-energy areas of the reticle. Since haze directly influences the optical response of the optics of the exposure tool, it's presence can be detected very early in the formation sequence as a change in the process response and dose-uniformity response of the reticle.
Metrology for haze detection requires a minimum of nine points on the field to be measured in a focus-dose matrix of exposures. More points per field will increase the accuracy of haze discovery.
Next Section to Read: " Process haze control automation"
Reference:
1) T. Zavecz, "Precise Measurement of Process Bias and its relation to MEEF", SPIE (2007) vol. 6520-139
ã Copyright 2007 TEA Systems Corporation, All rights reserved. Legal
TEA Systems
Corp. | Tel: +1 610 682 4146
65 Schlossburg St., Alburtis, PA USA