Reticle Haze Process Control using Weir PW
Sections (Links to 3 chapters)
1. Reticle-Haze sources, behavior and influence
2. Detection of reticle haze .
3. Process haze control automation .
Table of Contents
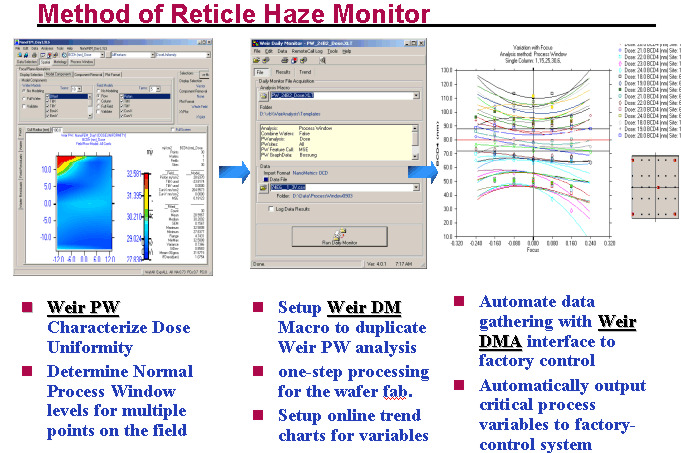
Weir DM Concept
 In
the previous section we discussed the derivation of Dose Uniformity and how the
method can be used to detect the onset of reticle haze or lens degradation due
to film deposition. This section illustrates how Weir Daily Monitor (Weir
DM) can be used to automate the analysis in a production environment for
a "two-click" selection of analysis scripts and data. The Weir DM scripts can
also be used for Weir DMA analysis; a complete analysis tool allowing Weir DM to
be called by external software and have the results submitted to external data
files for complete automation .
In
the previous section we discussed the derivation of Dose Uniformity and how the
method can be used to detect the onset of reticle haze or lens degradation due
to film deposition. This section illustrates how Weir Daily Monitor (Weir
DM) can be used to automate the analysis in a production environment for
a "two-click" selection of analysis scripts and data. The Weir DM scripts can
also be used for Weir DMA analysis; a complete analysis tool allowing Weir DM to
be called by external software and have the results submitted to external data
files for complete automation .
The Weir DM interface, shown on the right, provides two user fields; one for the Weir DM Script name and the second field lists the data file to be analyzed. The user interface has a check box that allows the output to be put into the data log file. The File menu also contains a command that allows batch-files to be defined for the consecutive analysis of multiple data files.
Weir DM provides the macro-encapsulation of Weir PW & PSFM analyses in the form of scripts stored in Microsoft Excel Templates (".xlt"). Each template defines the analysis plus the user's selection of graphics, statistics for the current dataset, variable trend chart tracking and output of variables for export to other user programs.
Weir DM Macro Creation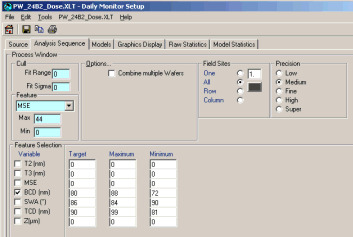
Begin the setup of a Weir DM macro by first loading a data file with the focus-dose matrix data that will be used for a Dose Uniformity analysis. It's best to use a data file uses the same metrology recipe. Weir DM will use this data workbook as a template for the Weir DM script workbook.
From the Weir Main or Weir Setup
interface, select the "Tools/Weir DM Setup" menu option from the menus and
specify the script name and data source directory if t they are different from
the name used as default. In the "Analysis Sequence" tab, select "Process
Window" and, from the list presented, the variables and their target values.
Insure that either "All" field sites or the site number to be selected are
entered into the "Field Sites" menu. In the example shown, a BCD variable
targeted to 80% +/-10% will be fitted to a process window dose analysis. The MSE
or measurement error variable will be used to cull poor metrology data points
from this OCD data set.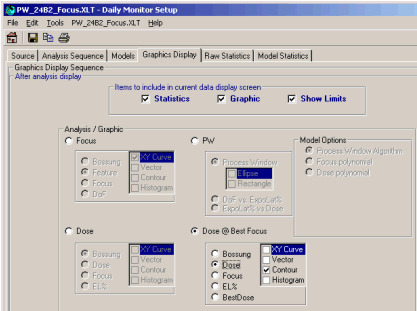
The Graphics Display tab will be used to select the type of graphics and statistics to be used for the current dataset analysis. These will be the graphics that show the performance results of the current data.
Since we want to test for Dose Uniformity, select the "Dose @ Best Focus" displays along with a contour plot of the field data.
The statistics to add to the trend charts will next be selected using the "Raw Statistics" and "Model Statistics" tabs. Raw statistics reflect the raw data as measured for the analysis. They will NOT include any data removed by the culling methods of the Analysis Sequence tab.
Model Statistics change depending upon the type of analysis as shown below.
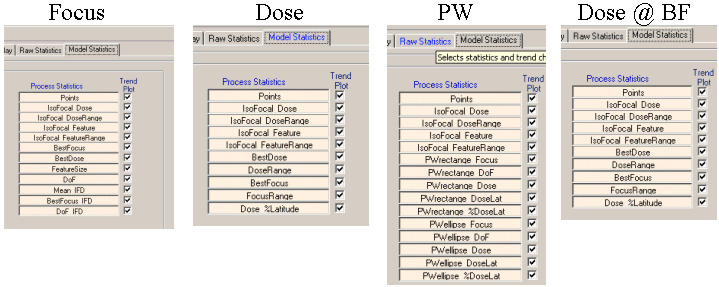
Selecting the "Dose at Best Focus" tab allows the dose statistics needed for Dose Uniformity to be characterized while removing the significant errors cause by defocus across the field of exposure. Two sets of statistics are selected with this chart. The "push button" selection title with each variable sets the statistic to display for the current data. The check-box entry will create and add the variable to a long term, multi-dataset plot of the statistic's trend. One variable trend-chart is created for each check-mark selected.
Save the template and exit template setup.
Running Weir DM for Dose Uniformity
Start the Weir DM interface and, from the interface shown in the first figure of this section, select the proper template and a data file. Next press the "Run Daily Monitor" control button. The data will be loaded and modeled according to the selections made during setup. After the analysis, the graphics showing the response of the current data will be displayed:
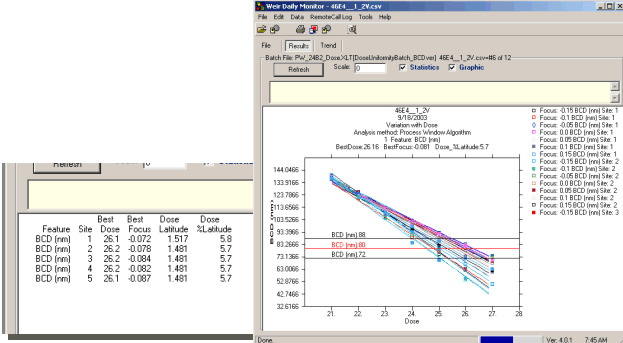
The displays contain both report summaries, that are also saved in the workbook spreadsheets, and the graphics selected from the sequence above.
If any raw statistics were selected from the trend charts, each graph can be displayed. More critical to our needs is a display of the dose-sensitive variables that can show the onset and growth of reticle haze as measured on FEM wafers for the example shown below.
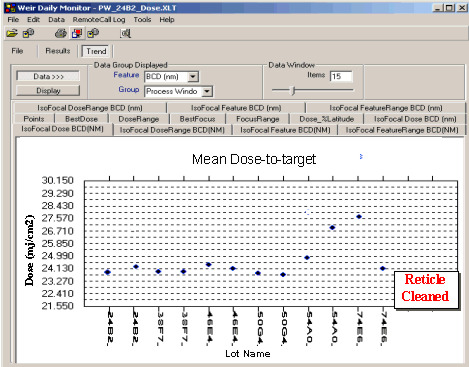
In this example the IsoFocal Dose was analyzed across the reticle. Haze growth begins to appear with the "54AO" lot and continues until the reticle is finally cleaned. Early warning of such variance allows the reticle clean operation to be scheduled for any convenient time rather than waiting for a yield or process "bust". An even more critical analysis would be to track and key on the IsoFocal DoseRange variable that looks at the range of dose values across the reticle as opposed to the average dose shown here. Dates or data-lot names can be selected for display on the graphic along with optional statistics reflecting the overall trend data.
Automation with Weir DMA
Weir DMA call:
-t "C:\Program\Weir Wavefront\DS1_FF_DMtemplate.XLT" -d 040615210805.txt -o D:\TEMP -x D:\TEMP
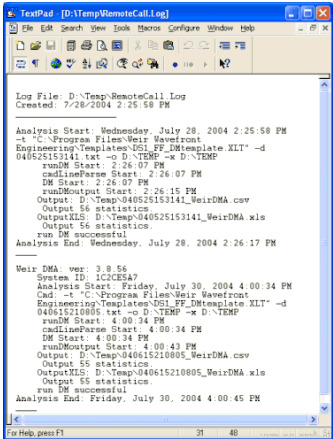 Weir
DMA running options, such as the location of the analysis log file, can be found
in the "Tools/Options" menu of the Weir DM interface. Since the interface runs
independent of operator control, a log file is maintained and it's size
controlled by Weir DM. The entries to the log file can be viewed from any Weir
DM interface menu and also reside in the log-file directory, specified in the
options file, to be viewed with any text editor. This screen shows the analysis
of two data files.
Weir
DMA running options, such as the location of the analysis log file, can be found
in the "Tools/Options" menu of the Weir DM interface. Since the interface runs
independent of operator control, a log file is maintained and it's size
controlled by Weir DM. The entries to the log file can be viewed from any Weir
DM interface menu and also reside in the log-file directory, specified in the
options file, to be viewed with any text editor. This screen shows the analysis
of two data files.
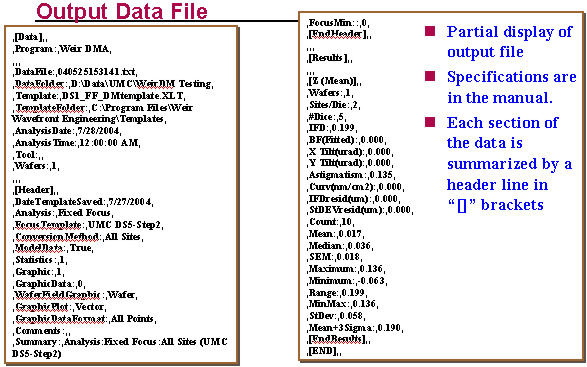
Outputs variables can be stored as either comma-delimited ".csv" data files or in Excel Workbooks.
Weir DMA Features
-
Ability to limit the size of the RemoteCall.log file
-
Ability to select a window size and location in the trend plot for plots with many data entries.
-
DMA screen for status reporting of DMA calls
-
Interactive beyond RemoteCall.log file.
-
Ability to control the length of display time for this screen.
-
-
Data Import Format included in Weir DM Template
-
Ability to select models and type of analysis
-
Ability to select full-field, full wafer and slit/scan models for focus or any metrology variable.
ã Copyright 2007 TEA Systems Corporation, All rights reserved. Legal
TEA Systems
Corp. | Tel: +1 610 682 4146
65 Schlossburg St., Alburtis, PA USA