 |
||
| Products | Services | User Log In | Contact Us | Company |
|
|
|
View probe locations, cycle, energy deposited and rise/fall times for each sensor
|
|
|
|
Correlate temperature, thermal flow, rise times, energy delivered to any set of feature profile metrology
|
|
|
|
Create movie sequences of cycles
|
|
|
|
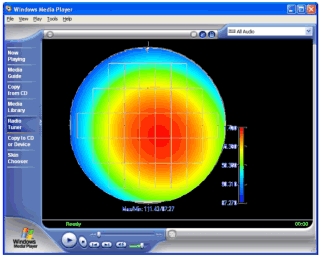
Single or multi-window photogallery of temperature, rise-times, thermal flow, energy etc.
|
|
|
|
Response at each probe point can be evaluated to determine it's variance with respect to other points on the wafer. |


Software suite for enhanced Hot-plate/Chill-plate and Feature Profile uniformity. The process is uniquely optimized for uniformity using covariance with any measured feature profiles.
Data Input
- Any film or feature metrology data
- CD-sem metrology, overlay, scatterometry, Ellipsometry
- Process simulator outputs
- Thermal-sensor data from any data source
Storage
- Microsoft Excel TM Spreadsheets and workbooks
- Open system; access to all raw, calculated and modeled data.
Applications
- Thermal process optimization and characterization
- Hotplate/chillplate matching
- Process development
- Simulation variable validation and calculation
- Simulation results validation
Dimensional spreads across the wafer during each lithographic imaging step are most strongly controlled by the speed and uniformity of the post-exposure bake (PEB). During the PEB a thermal dose is delivered to latent acid image of the exposure to drive the deblocking reaction that changes the solubility of the resist in the develop step.
Device critical geometries
are rapidly approaching 40 nanometer (nm) node with tolerances of about
2 nm, 3 sigma variation about the feature size. Since the sensitivity of
deep ultraviolet (DUV) resists to temperature variation during the PEB
range around 3 nm/oC, it is critically important that uniformity of the
bake cycle be closely characterized, controlled and monitored during
production.
LithoWorks PEB™ provides tools to characterize, model and control the
uniformity of critical feature dimensional variation arising from the
PEB process step. LithoWorks PEB is capable of gathering data from any
thermal mapping product including the OnWafer and SensArray temperature
monitors. Critical dimension (CD) data are gathered from measurements
taken by many commercial sources including CD-SEM's, Scatterometry,
Ellipsometric and Electrical Linewidth Measurement (ELM) tools. Thermal
and CD data are then convolved using models and SLS proprietary analyses
to characterize the PEB cycle and set it's control variables to minimize
variations across the wafer.
Perspective
LithoWorks PEB© is used to minimize process variation of critical dimensions within the process window. The LithoWorks suite provides an open system of access and versatility for the process engineer. Any form of metrology data can be easily imported. Data, analyses are results are all conveniently stored in Microsoft Excel© workbooks for easy access and customization. Analyses are conducted using the unique object-oriented lot models and interactive graphics of SLS Inc.
See the
Software Requirement Specification for more details.
Features
- Automatically converts any data into Excel Spreadsheets.
- Adaptive models, raw data and residual spatial analysis interface.
- Analyze the entire bake cycle including Temperature, rise/fall times, variation mapping, time-at-temperature, integrated energy and integrated energy variation across the plate.
- Model wafer dependant variations of films and feature profiles.
- Automated orientation calculation for BakePlate-to-Exposure-Tool alignment.
- Automated exposure layout and tool configuration with the Weir layout interface.
- Exposure tool library for storage of tool characteristics.
- Object-oriented structure with point-and-click graphics and culling.
- Advanced graphics includ histograms, vector, range, XYplot , BoxPlots, Population Density, contour, bulls-eye and 3D plotting.
- Easy sub-set data selection; automated and manual Data culling ... automated by wafer, field, site, range, NA, PC (Sigma) and manual mouse-selection.
- Full wafer models with coefficient removal and simulator for “What If?” scenario investigations.
- Thermal variable to film/feature distribution correlation and covariance matrices.
System Recommendations
LithoWorks PEB is a compiled application with a full object oriented, mouse-interactive interface. Drill down graphics and spreadsheet analysis supported. Functional on Windows NT and Windows 2000, XP etc. Microsoft Excel is required.
Recommended hardware:
- Pentium IV, 2.0 GHz,
- 512 Meg of RAM,
- 1024x768 Graphic Monitor and
- 30 M free space on disk for programs.
- Data storage may require up to 2.0 Gigabytes additional.
ã Copyright 2004 TEA Systems Corporation 65 Schlossburg St., Alburtis, PA 18011 All rights reserved. Legal