Weir PW: An improved method for Anti-Reflective Coating (ARC) performance comparison.
See Also: Weir PW Brochure, Weir DM Batch Processing
Other Tutorials: White Paper Tutorials
Contact TEA Systems for a Weir Demonstration or Logon
Objectives
-
How to improve Critical Dimension (CD) metrology from a Scanning Electron Microscope
-
Optimize the process for high-quality fast devices in addition to simple functional yield.
-
Improved methods for sub-90 nm process setup and optimization
-
Greater accuracy in the comparison of Anti-Reflective Coating (ARC) performance
-
Techniques can be applied to any film comparison
-
-
Removing tool and process perturbations from the analysis
Keywords: BARC, ARC, TARC, DoF, Focus, Depth of Focus, Uniformity, IFD, process setup, metrology, model, Exposure-Dose, lithography cell, HTML Reporting
|
Table of Contents
|
Tables Listed
|
Introduction
Film and process comparisons are
complex and susceptible to errors introduced from many sources. ARC and
photoresist evaluations are complicated by the introduction of process and tool
perturbations injected during the exposure that can bias results away from the
true process response. This is particularly true when the nominal exposure
setup of the experiment is prejudiced to an anticipated, favored result.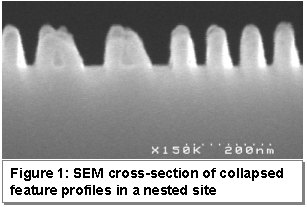
The strenuous process excursions encountered in focus-dose exposures when measured by automated metrology tools often include measurements of the wrong feature or damaged features, such as shown in figure 1, in the tools attempts to find a target in areas where no valid structures exist. When not excluded by the metrology tool software, these measurements result in large errors that can be culled or removed from the data using various automated and manual techniques within the Weir software.
A common and even more sinister source of "soft" errors comes from metrology gathered from automated tools such as scanning electron microscopes (SEM or CDsem). CDsem's introduce more than the relatively small dynamic and static precision errors that they are periodically tested for. CDsem "soft" errors do not exhibit large excursions from the good data but rather a small excursion that exhibits a disproportionately large influence on the process model and it's precision.
Soft errors often include the gathering of data from "non-targeted" metrology-sites or just poor lithography images. For example, feature-nests residing near the process limits frequently contain collapsed structures, such as shown in figure 1, or even structures with missing elements resulting in measurements that are 1.2 to 3 times their proper size. Even smaller but still influential excursions that can bias modeled results arise from misplaced measurements caused by limitations in the tool's targeting and acquisition algorithms. Misplaced measurements become more prevalent near the substrate's edges and in process-marginal exposures where target shape can change dramatically. Extreme variations in feature profile shape at the exposure limits, the underlying film stack, differing close-neighbor structures and the electron-beam acceleration potential can also non-linearly bias data measurements resulting in soft errors1.
Soft errors are most abundant if dense-packed features with high aspect ratios are measured in a focus-dose matrix. These "soft" errors result in the gathering of apparently valid data when viewed in the context of the entire data set but stand-out as anomalies when compared against similar "good" measurements that have been also biased by the same systematic errors or exposure conditions. A model sequence that does not remove soft errors will bias process window and precision calculations during process centering and setup because the bad data forces the model to adapt to process excursions that do not truly represent it's response.
The large data errors are often excluded by the metrology tool software while soft-errors are typically not addressed. However, because of the small process margins encountered below the 90 nm node, the importance of soft errors increases when comparative studies or critical process setups are the end-goal.
One approach to a collapsed-line solution has been to combine a visual observation of each measured site with the site metrology. In this approach a nested pair of nine dense-packed features is manually observed to contain either all or fewer well-defined profiles; in the data used in this experiment a profile count from one-to-nine giving the total number of "good" features in each exposure nest. Because the method is manual, this is a tedious and error prone approach that involves an engineer sifting through good and bad measurements in a decision process on what to include in the calculations. If a different "good" threshold is defined, then the user must again manually sift the data and recalculate the statistics.
To help the engineer in these areas the Weir Analysis Software contains a graphic user-input interface that allows user-defined data to be added to an existing dataset solely based upon its location in the exposure matrix. This interface allows the manual-gathered "collapsed line" data to be easily and precisely entered as part of the data array. Additional program tools allow the culling of large even the smaller soft errors sources with the mouse prior to starting the final analysis and automatically during the analysis sequence.
This report demonstrates the use of CDsem data along with visual observations of the number of standing, nested feature profiles in a focus-dose matrix to limit the scope of acceptable experimental data. Several methods for identification and removal of smaller soft errors are shown. The data is then used in a process window analysis to obtain a first approximation of ARC performance for several commercial products on 80 nm half-pitch structures. Process Window size by itself is shown to not be the sole or even optimum criteria for feature quality, edge roughness and process-excursion tolerance. Additional information for robust response and tolerance to process anomalies and sub-film variation for each ARC film is derived from extended empirical model analysis of the data.
Experimental Setup
An Hitachi CDsem was used to measure sites with nine 80 nm lines nested in 160
nm periods (1:1 or 80 nm half pitch) from a clear field, 9% attenuated PSM reticle. Exposures were
performed at 193 nm using commercial resists with six Bottom ARC (BARC)
films and one substrate without ARC. Each exposure field was then
visually examined and the number of standing lines recorded and later entered
into the Weir data.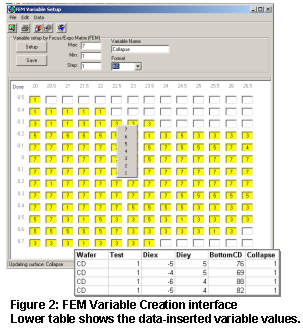 Approximately 147 data points were were measured for each of the six films
with a target value of 80 nm +/- 10%.
Approximately 147 data points were were measured for each of the six films
with a target value of 80 nm +/- 10%.
The CDsem bottom measurement data was loaded into Weir with each film set up as a different target site. Weir defines the imported Hitachi targets as different "families" of the same measurement and the data is recorded on the Weir Sites worksheet. Weir PW software can then use the process families to automatically sort the results of each film type.
An engineer then used the Weir Main Layout interface to graphically setup the focus and dose array information for each wafer since the CDsem data did not contain the Focus/Dose information.
The number of standing or "Collapsed" structures is entered using the "FEM Variable Setup" interface shown in figure 2. This interface can be reached using either the "Setup FEM Variable" button on the Weir Main button-bar or the command button of the same name in the Weir PW, Process Window tab's setup screen shown in figure 5.
The FEM Setup screen of figure 2 presents a matrix with focus and dose values on the ordinate and abscissa of the graphic. The engineer can then enter in a new variable name such as "Collapse" or an existing variable name. If an existing name is entered the data will be uploaded into the FEM matrix as shown when the "Setup" command button is selected.
The "Max, Min, Step" fields are used to populate a Pop-Up chart as shown in the center of the figure and in this case ranging from 7 to1 in steps of 1. Values are entered into the yellow fields using either the mouse and keyboard or by selecting a value from the pop-up. The pop-up is activated for each field by selecting and then right-clicking on the data-field with the mouse.
When all the data values have been entered select the "Save" command button to update the Weir data sheet. A small section of the resulting Weir data sheet is shown in the lower right corner of figure 2 with the "new" collapse data added.
While in this setup interface the user can view the data as a spreadsheet using the "Data" menu and choose to display it as either a Weir data sheet or as a FEM surface that can also be used to plot an Excel Surface plot.
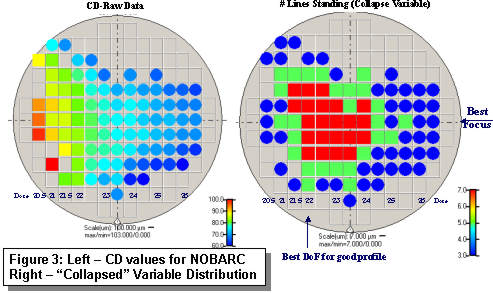
The resulting layouts for the CD (feature-bottom) and Collapse variables are shown in figure 3 for the data with no BARC film. Target values for the process are 80 nm +/- 10% with 5 or more of the 7 lines, in this data instance, still standing. Using this standard Weir Data Plot it's easy to select the optimum focus and dose for the film and estimate the process window without the aid of a formal algorithmic analysis. However a formal analysis can add additional information as we shall see in the next section.
Process Window Data
Setup and Evaluation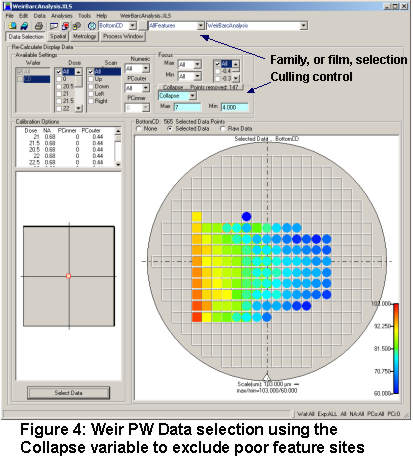
Figure 4 shows the Weir PW data-selection interface and the first set of tools for data culling and subset selection. The "collapse" variable is now used to restrict the range of variables to include in the calculation. Figure 4 shows that "All Features", that is all BARC-film families, have been included in the data. The engineer could have restricted this to anyone or a subset of the total number of families using this control.
The Collapse variable has been selected from the "data cull" control and a range of 7<collapse<4 lines standing is set into the range-limit fields. A total of 147 data points, shown on the control's command button, have been removed from the data. The engineer could just as easily have selected only those sites with all 7 features still standing for the process window analysis.
The wafer-graphic at the bottom of the figure shows the resulting distribution of data with the light-blue sites in the center of the wafer equating to the 80 nm target feature size.
In the wafer graphic of figure 4 there appears to be one site showing a dark blue, or a feature size less than 60 nm, located in an odd location in the top left quadrant of the array. We can see that this metrology value is not normal since it's near neighbors in the focus/dose matrix all appear to be ranging from 80 to 90 nm in size.
This soft error be poor CDsem metrology
and could easily be removed by simply boxing it with the mouse and culling
the point. However we have several layers of data here representing multiple
films and the point may be associated with a completely different films'
response that simply covers a wider focus range of valid data points than those
plotted on the last layer of data shown here. The Weir PW software
has additional features under the process window tab that will allow these data
points to be culled as shown in figure 5.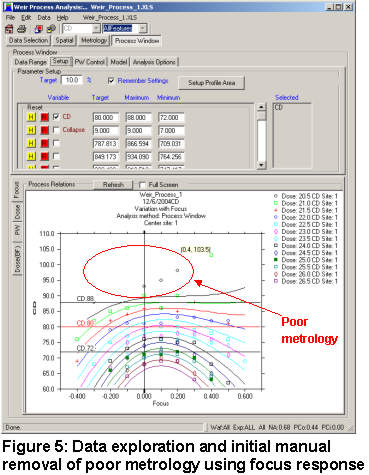
The analysis now moves from the "Data Selection" to the "Process Window" tab. Figure 5 shows the setup for a process window analysis with the CD target value set to 80 nm. The "Analysis Options" tab has been used to specify that the focus response analysis used the process window model rather than a focus-polynomial; this interface is not visible in figure 5.
The "Focus" tab is then pressed to display the family of curves shown in figure 5. We can see from this plot that 3 points at the lowest dose value are not behaving rationally with respect to the model and may have been either poorly measured or improperly classified and not removed by the "collapse" variable cull. These points are "soft" data errors and result from the CDsem algorithm's in-ability to cope with feature profiles that differ significantly from the ideal feature response seen near best focus and dose.
The engineer manually removed these data points from this analysis by boxing them in with the mouse and selecting the cull function from the pop-up menu. Additional automated Range and Sigma culling tools are available in the "Data Range" tab of the interface. These soft data points could also have been removed using these automated culling tools.
Run the Process Window analysis by pressing the "PW" tab. Figure 6 shows the graphic for both systematic and random process window response and, on it's right site, the "Process Window Report" spreadsheet for the analysis. The report is created and stored in the data workbook after every analysis and can be saved, along with it's graphic, to any web or spreadsheet format.
The BARC response shown in figure 6 favors a random process optimum dose of 24.4 mj/cm2. This is for the situation where 7 or more of the feature profiles were required to be standing. The Dose is reasonably close to the isofocal dose of 20.89 mj/cm2 but not as near as that obtained for the NoBARC study. Optimum focus is at approximately 0.10 um defocus with a Depth of Focus (DOF).
The Depth of Focus and Exposure Latitude variables are typically used to compare performance of BARC films. However, these response graphics become very complex when all six films are included. Fortunately the spreadsheet report provides a summary of each families response that can be compared.
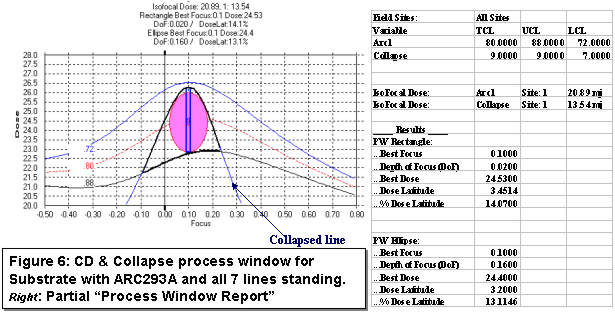
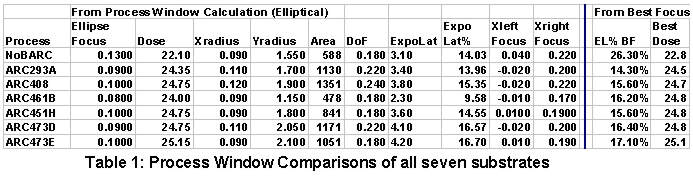
Table 1 shows the film process window response gathered from two analysis techniques; the process window ("ProcessWindowReport") and, shown on the right side of the table, the focus response analysis ("FocusResponseReport") spreadsheets.
These two reports
yield slightly different responses for the Exposure Latitude (EL). The "Best
Focus" analysis does not rely on a rectangle or ellipse area to determine the
exposure latitude. This focus-polynomial method is the one typically used to calculate resist
performance and determines the EL value at the best focus setting and
therefore provides an additional view of the film response.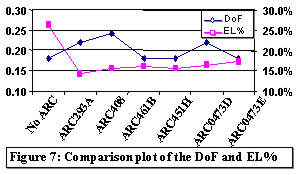
The tabulated results of the analysis for random process or elliptical response suggest that the ARC408 film has the greatest DoF = 0.240 um and still retains an Exposure Latitude (EL) = 15.35%. Since Weir PW process reports are saved in the Excel Workbook it's easy to generate comparison plots as displayed in figure 7.
We can see from figure 7 that ARC473D, on the other hand exhibits nearly as good DoF =0.220 um with an El= 16.57%. ARC473E is therefore another good candidate when the EL% is measured by both the process window and Best-Focus analysis however it's DoF is significantly lower. The ARC293A film has a very nice DoF but it's exposure latitude lags behind all the other films.
In all, there is no clear performance winner with this approach. Visual determination of the number of collapsed lines is highly error-prone and a second experiment could easily result in slightly different results. Under these conditions and with classic analysis methods the BARC selection would normally then be relegated to financial or convenience factors rather than technical.
We next turn to other considerations to derive the optimum performance film that involves not only the process scope of each film but also the robustness and profile response characteristics.
Analysis of Robustness of the Process and Device Quality Enhancement
Feature uniformity and edge roughness are increasingly important factors in an industry that relies not only on high yields but also on a range of product performance levels that dictate the margin of profit for shipped product. A good example of this phenomenon is the difference in market prices for microprocessors based on clock speeds and memory chips based on access times. The process objective should therefore be to not only obtain high-yields but also to fabricate products with the optimum design performance levels.
If we take the Weir CD wafer plot of figure 4 and use the mouse to box-in the two rows representing the range of feature sites about the optimum focus we can generate the plot shown in figure 8 from the pop-up menu that appears. We then right clicked on the graph and added a first-order polynomial fit to each films' curve; these polynomials are also shown on the graph. The advantage of figure 8 is that it compares the feature response of each film to small perturbations of the process about the optimum focus. The ideal film response in this graph would be a curve with nearly zero slope and no scatter about the best-fit curve.
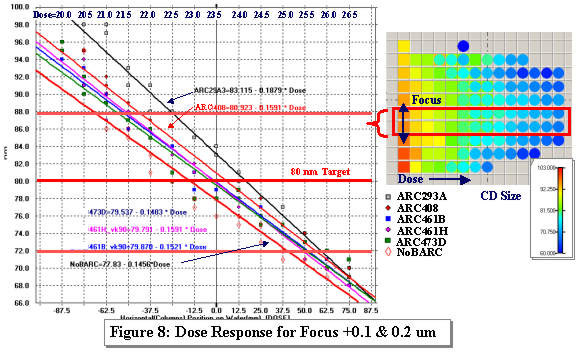
An obvious response now visible upon examination of figure 8 is that the NoBARC film requires the lowest amount of exposure to achieve the 80 nm target size. The slope of the NoBARC curve is significantly lower than any of the other films thus implying a greater exposure latitude (EL) and confirming the results of table 1. The lower exposure value translates into greater throughput for the exposure tool, and thus greater capacity for the facility. Although it's not shown in figure 8, we can see from Table 1 that the NoBARC scenario also exhibits the lowest Depth-of-Focus (DoF). The addition of a BARC therefore reduces capacity in the facility with the hope of increasing device yields through the increased in DoF.
Depth of Focus is the driving force for introducing an ARC. Ideally the engineer therefore needs to identify the ARC process that yields the greatest DoF while maintaining a reasonable dose and EL and this is the rational followed in the previous section that resulted in no clear difference in performance.
If the points around the curve the curve for each film are carefully examined, we can see that the data distribution about the linear-fit curve exhibits more scatter, or CD variation on some films than on others. This scatter is stronger with some films than others and suggests that the choice of ARC film also influences process response in the form of greater precision in the replication of the image.
Given these facts, the first approach in considering the appropriate ARC would be to select the ARC473D film as represented by the green squares and fit-line as the film containing the greatest EL. This decision correlates with the conclusions derived in the previous section as having a good balance between DoF and EL. What is needed is a quantitative method for determining the precision response of each film to process perturbations and therefore a deterministic method of selecting for robust performance across process perturbations.
Modeled
Response Evaluation of BARC Films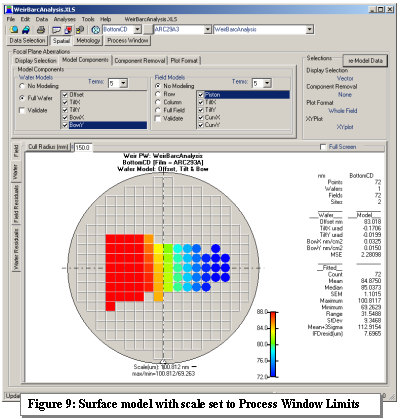
As with the process window analysis, the data must be properly culled by both response and Collapse-variable range to obtain an accurate representation of the process response for each film. For this implementation of the analysis we selected the "Spatial" tab in the Weir PW interface and ran the radial-format wafer-model shown in Figure 9 for the focus-dose matrix associated with the ARC293A BARC.
The wafer model for this implementation was restricted, using the control in the upper left of the screen, to 2nd order terms that, since we are extensively culling out the poor metrology points, will closely model the exposure response surface of the BARC.
The data was further restricted to sites with all dense-packed features still standing using the data selection interface shown in figure 4. We also installed a 0.2 nm range culling variable into the fit-function using the fields in the "Display Selection" tab of this interface. Finally, after it's calculation and display, we right-clicked on the graph to set the display-scale to the 10% CD process window specification shown in the color-bar key. Deep-red or blue points are therefore out of the process windows bounds.
Tabulated results for the modeled data of each film can be found in the Weir "WaferResponse" report, portions of which are shown in tables 2 and 3. Since all films have been exposed to the same range of focus and dose, the modeled , and therefore preferred value for each film as well as the variation about that value quantifies the robustness of the film to process variations.
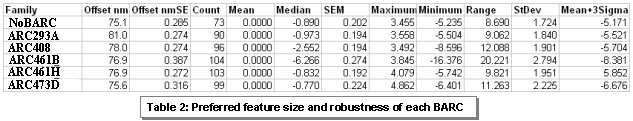
The data in table 2
displays the offset of each film's modeled process response and the residuals to
this offset. Since our data culling has removed any potential poor image or
metrology data, we can now see the true variation of each film. The residuals
to the fit-offset also include the random and systematic errors of the
exposure and metrology tools so the analysis includes both process and tool response.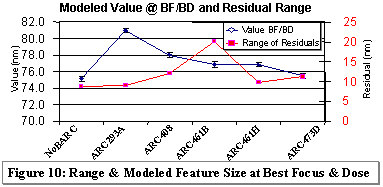
The lowest range of variation about the wafer-nominal value is exhibited by the NoBARC film and closely followed by ARC293A and ARC461H as shown in the Excel graph of the report shown in figure 10 with the residual range plotted on the right-hand ordinate. This graph implies that the BARC improves the systematic depth-of-focus at the expense of feature uniformity as well as exposure. ARC293A exhibits the lowest range and standard deviation about a median value that is very close to the target of 80 nm. Recall that in table 1 ARC293A also exhibited the greatest need for additional exposure and presented only a moderate increase in the DoF. ARC461H would also be a good choice for this facility considering it's low residual range and the DoF improvement reported in table 1.
The analysis just performed included data from all of the metrology thereby reflecting the response of each film to the exposure and metrology tool signatures of the facility in which the data was exposed. Tool independent process stability can be calculated if the film's systematic response to focus and dose over the range is examined. The second section of the "WaferResponse" report shown in table 3 examines the variation in feature response that result from only the systematic process perturbations.
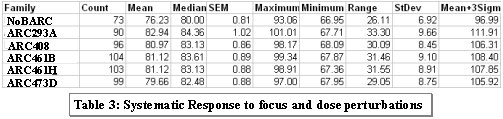
Film response, independent of metrology and exposure tool artifacts, is a critical element in determining the true response of each coating. Table 3 demonstrates that the lowest Standard Deviation of feature sizes due to focus and dose variations is found with the bare substrate. One important observation to include in this analysis is the number of data points remaining in the data. Observe that the NoBARC film has had it's 147 data points culled to only 73 measurements because of poor feature replication and metrology. This implies a lower overall tolerance of the bare substrate to extreme variations of focus and dose and at the same time promises improved precision if the process could be maintained within the demonstrated boundaries.
Based on the standard deviation of the systematic response (StDev) the ARC473 D now appears as the best performing coating for general process tolerance and, from table 1, was shown to be one of the best performers for EL and DoF optimization.
We can next visualize the systematic process response of these variables at best dose and focus by using the mouse to box-in portions of the wafer graphic of figure 9 and selecting two plots from the pop-up menu to generate the charts shown in figure 11.
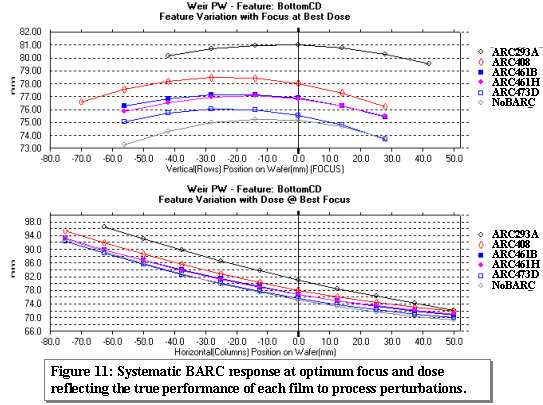
The top graphic of figure 11 plots feature variation with focus for the row of data generated by the 24.5 mj/cm2 dose. This is the optimum dose for the ARC293A coating but would result in data within the process window for any of the films. In this case the ARC408 coating represents the dataset with the greatest range of good data. There is a distinct shift in optimum focus between the films with the NoBARC and ARC293A films residing closest to the 0.0 defocus setting of the tool, a critical observation to note when multiple lithography cells are being matched. Notice there is also a slight change in slope of the curve indicating a different sensitivity to lens aberrations among the BARC and bare substrates.
The ideal response of each film to dose is shown in the bottom graph of figure 11 for the 0.0 um defocus column of data. Here we can again see the need of the ARC293A BARC's greater exposure and, in keeping with it's greater slope, the lower EL of the film.
This analysis demonstrated the implementation of visual observations, such as the number of collapsed lines in a dense packed feature set, can be easily added to a focus-exposure matrix using the Weir PW interface. Weir PW also has the tools to identify and cull the smaller but critical soft data errors using both manual, mouse-drive interactions or automated range and sigma-based culling during the model sequence.
The performance of several commercial Bottom Anti Reflection Coating (BARC) films were evaluated using the common method of process window evaluation. We discovered that even in this tightly controlled data set metrology errors in the form of minor variations from the anticipated systematic behavior of the data were present and could only be clearly discovered during an examination of the focus-modeled results.
No clear cut performance winner could be determined from the process window method which presented the conclusion that all BARC films were adequate for a 80 nm process node. We therefore concluded that any film could be selected depending upon the engineers desire to optimize either the DoF or EL% while sacrificing the performance of the other.
To provide additional clarification of film performance the analysis turned toward a modeling of the systematic process errors of each film that also incorporated the removal of the above mentioned data culls. This modeling again used Weir's ability to select data based upon the number of nested features properly imaged across the matrix.
An examination of the residuals to the modeled offset demonstrated that the ARC293A film generated a greater of DoF and a smaller range of variation due to both systematic and random process errors. The ARC293A film therefore, at the loss of some DoF and EL range, yields improved feature replication and imaging across the tested variation of focus and exposure dose but with some loss to throughput due to the greater exposure needed to obtain target size. The ARC293A film is therefore the most robust BARC for this process and equipment set.
Systematic response of the films show the performance of each BARC independent of the particular exposure and metrology tools used to collect this data set. The analysis of systematic errors in table 3 illustrates that the range of acceptable measurement can vary significantly across the substrate from BARC selection to selection. The optimal performance was exhibited by the ARC473D film that yielded only 8.75 nm standard error to the programmed exposure-dose and focus variation. ARC473D in table 1 presented one of the strongest improvements in DoF while maintaining a reasonable EL and is therefore the selection choice as the most stable BARC for process-independent performance.
While the DoF and EL are critical components to needed to center a process for production they are not the best metrics for performance comparisons. Profitability in today's market hinges as strongly on high-performance products as it does on base manufacturing yields. An comparative analysis of process films should therefore consider the robustness and precision of the film as well as it's ability to provide and acceptable process window.
1. C. Yates, G. Sapp, P.Knuturud, "Characterization of e-beam induced resist slimming using etched feature measurements", pub. SPIE (2005) vol. 5752-153
Moving to Other Weir Interfaces
Weir program interfaces work interactively. You can move from Weir Main to any of the other five interfaces using the button-bar keys or the menu. Data is automatically transferred between interfaces. Any interface can load and, using the Weir Layout Library, configure exposure layouts for the arrays. Only the Weir Main interface can create Layout and Reticle Library Entries and Macros for the Weir Daily Monitor and DMA programs.
Interrupting Processing
-
The "ESC" key will interrupt any processing if it is held depressed.
-
Weir Reports can be saved to any website. To save the report, open it's spreadsheet in Excel and select the "File/SaveAs" menu. When the pop-up interface appears, select the "Web (htm,html)" format.
Graph Customization
-
Graphs are easily copied using the Edit Menu selections, the button bar and by boxing-in a section of any plot with the mouse.
-
To edit titles, rescale graphs, and add box-plots, trend-lines and fitted curves, right click on the graph and use the Graphic-Editor interface.
SpreadSheet Control
-
A "Spreadsheet" menu is located near the top right-hand corner of the Weir program interfaces. It will be listed as the name of the loaded Weir Workbook. The menu shown in figure 3 is using the name "KLA_SAMPLE.XLS".
-
Clicking on any spreadsheet menu will bring it to the forefront in the Excel Workbook.
-
Selecting the "Delete Worksheet" submenu will open an interface that will interactively allow multiple worksheets to be deleted from the workbook.
-
An "Index" worksheet positioned at the 3rd tab of the Weir Data workbook lists and links all of the worksheets created for data, reports and analysis summaries.
Automation
-
This entire analysis sequence can be automated to two-clicks of the mouse using Weir DM and Weir Automation Macros.
-
Weir DMA provides an external program portal for non-interactive analysis by Advance Process Control and Factory Automation programs.
TEA Systems
TEA Systems offers products to model films, photomasks, wafers, feature profiles, process and lens data for characterization and setup of semiconductor design, simulators, tools and the process.
TEA Systems, a privately held corporation since 1988, specializes in advanced, intelligent modeling of the semiconductor process and toolset. Products from TEA allow the user to decouple process, tool and random perturbations for enhanced process setup & control.
TEA Systems products include:
Weir PSFM: Full-wafer/field/scan analysis tool for FOCUS derived from proprietary defocus sensitive features.
Weir PW: Reticle/Full-wafer/field/scan analysis for any metrology with advanced process window capabilities for both wafer and photomask control.
LithoWorks PEB: A tool to link and correlate profile, film and critical element control to thermal reactions such as PEB and ChillPlate
Weir DMA: Macro Automation interface for Weir PSFM and Weir PW for external program calling, automated data gathering or one-button analysis of commonly used sequences. Includes data trending and web interface.
* Excel is a trademark of Microsoft Corporation
ã Copyright 2006 TEA Systems Corporation, All rights reserved. Legal
TEA Systems
Corp. | Tel: +1 610 682 4146
65 Schlossburg St., Alburtis, PA USA