 |
||
| Products | Services | User Log In | Contact Us | Company |
 |
|
Enhanced process window analysis Plots for multi-site, multi-feature process windows, CD vs Dose, CD vs Focus, Dose at Best Focus and Isofocal Analyses |
 |
| Optical CD algorithm development/validation |
 |
|
Spreadsheet storage of data and analyses |
 |
|
Wafer & Field Spatial models SWA variation across wafer Simple, user-selected model components
|
 |
|
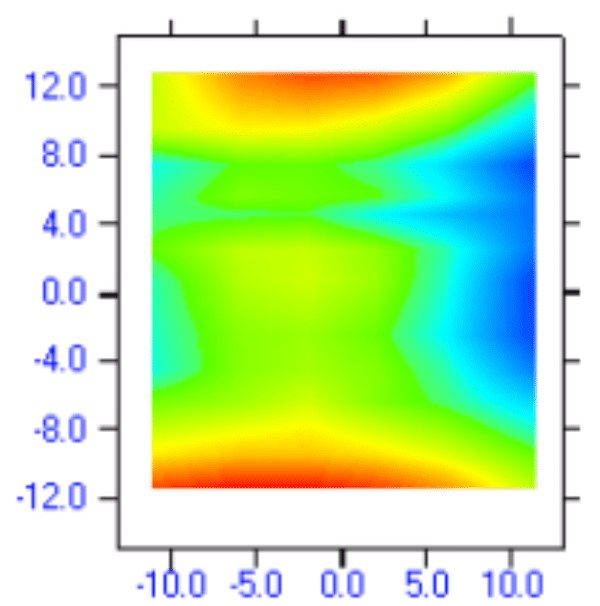
Modeled Bottom Critical Dimension Average field with right-side lens aberration problem
|
 |
|
Analysis Drill-Down Mouse-selected field area XYplots
|
 |
|
Exposure Layout Tool Automated and manual tools to define focus, dose, NA, Partial Coherence and scan direction
|
|
|
|
Depth of Focus surface Across field analysis for scanner |
 |
|
TARC Uniformity Raw data collected from scatter-tool on top-layer Anti-Reflective coat uniformity |
 |
|
IsoFocal Analysis Process window response surface derivation of IsoFocal for multiple sites and features plus aberration estimation of current lens system. |
 |
|
Population Density BoxPlot BoxPlots, fitted curves, messages etc. can be added to any XY-graph. This is a BoxPlot displayed as a Population Density plot with the red-members representing the median and curves added for the 5% & 95% ranges. |
 |
 |
|
Field Dose non-uniformity for BCD Weir PW modeled BCD variation resulting from end-of-scan speed changes Top: Contour Bottom: 3D Plot |


Overview Brochure
An engineering process modeling workbench for setup, tuning, characterization and control. Weir PW analyses can be encapsulated into macros and production automated with trend charts using the interactive Weir DM or callable Weir DMA
More than just process
window analysis!
The most accurate and powerful control surface modeling software suite
for the process lithography sequence.
- Any film or feature metrology data
- Drag & drop file loading
- CD-sem metrology, overlay, scatterometry, simulation output etc
- Custom reticle data
- Simulation outputs, Focus-Exposure Matrix spreadsheets and much more.
- Open, documented data and report formats
Storage & Reporting
- Microsoft Excel TM Spreadsheets and workbooks
- HTML Reports; many reports are generated and stored in the data's Weir Workbook. Reports and graphics can be saved into HTML format for display on any web site.
- Open system; access to all raw, calculated and modeled data.
Applications
-
Reticle & Photomask
-
Process Control
-
Data encapsulation for signature transmission
-
Signature encapsulation
-
New design qualification
-
In-process reticle validation
-
Feature derivation from semiconductor imaging
-
Signature removal for semiconductor process setup.
-
Reticle library entry
-
-
Simulation Support
-
Results feedback and verification
-
Profile validation n and optimization
-
Process tolerance derivation for Design for Manufacture
-
MEF (Mask Error Factor)
-
Full-field uniformity for exposure qualification
-
feature & site specific derivation
-
Reticle feature signature derivations
-
-
Lot, wafer, reticle, field, lens and scan signature derivation
-
Process window extrapolation
-
Feature response confirmation
-
Constants derivation
-
OPC, etch and dose bias signatures
-
-
Characterization & Optimization
-
Focus and dose signature mapping
-
Reticle stage direction sensitivity mapping
-
Reticle bow mapping
-
Reticle Enhancement Technique (RET) results
-
Reticle feature derivation from wafers images
-
Optical Proximity Correction(OPC) tuning
-
Hot-plate setup
-
IsoFocal response plots
-
-
Setup
-
Exposure tool stage, wafer-leveling, scan direction, lens slit performance on profiles,
-
Process setup; multi- feature & film
-
Exposure tool specific, full-field process windows
-
Reticle and wafer signature removal
-
MEF uniformity and stability
Hot plate setup and thermal correlation.
-
-
Process Window Analysis
-
enhanced full-spectrum model and analysis
-
user selected features and field-site locations
-
reticle site-uniformity estimation mapping
-
reticle qualification and validation
-
-
Film and critical feature
-
automated error-budget and precision calculation.
-
exposure uniformity and spatial characterization.
-
scan dose-linearity analysis
-
wafer, field, slit, scan and site perturbation analyses.
-
model and simulations for “what-if” scenario queries during tool tuning sequence.
-
2D and 3D control surface mapping.
-
bias surface mapping to reticle feature and load-level.
-
optional removal of selected modeled, raw and reticle errors before analysis.
-
-
Exposure Tool and Metrology
-
characterization and critical setup
-
error-budget and electro-mechanical precision module.
-
performance models and variable covariance mapping.
-
-
Yield Analysis
-
Reticle performance evaluation
-
Reticle Enhancement Technique (RET) optimization
-
Feature and film profile mapping
-
Deposition, etch and film uniformity modeling
-
Exposure; source and uniformity mapping
-
Film uniformity mapping
-
Performance and process daily monitor
-
Weir PW is a engineering tool for
process and equipment engineers. Part of the Weir Engineering Software
Suite, Weir PSFM and Weir PW provide complete and comprehensive tools
for control of the lithographic tool and process environment.
Use Weir PW for both process and tool:
-
Critical Dimension (CD) and film distribution calculations
-
such as side-wall angle uniformity mapping.
-
-
Correlate, model and simulate spatial distributions of features.
-
Model systematic performance for wafer, field, slit and scan.
-
Discriminate wafer chuck from reticle platen tilt and bow.
-
Automatically remove selected wafer and reticle systematic errors prior to process window and other calculations
-
Calculate and plot metrology and process variable covariance.
-
Calculate the true Process Window for:
-
multiple feature types
-
non-isometric boundaries
-
multiple sites across the field
-
multiple values of Numeric Aperture (NA), PC (Partial Coherence inner & outer) and stage/slit scan direction.
-
Interactive process window viewing of Depth-of-Focus and exposure latitude tradeoffs.
-
Weir PW automatically imports and formats data from SEM’s, scatterometry, simulations, ELM, Optical and X-ray tools. Automated and manual mouse- interactive data culling methods are employed. Software can be used as an APC or tool tuning module. Output can be paper or binary media with control element output to optimize tool settings.
The Interface
Data import is set up using a simple windows-graphic controls. The system
is an “open” tool with data stored and easily accessed using Microsoft
Excel Spreadsheets. Worksheet macros are not used but can be user-added if
desired.
Features
-
Data Import
-
Automatically converts any data into Excel Spreadsheets.
-
Easy sub-set data selection; automated and manual
-
Data culling ... automated by wafer, field, site, range, NA, PC (Sigma) and manual mouse-selection.
-
Import of any metrology data set and process simulator output
-
Export reports and graphics
-
Spreadsheet access to data, graphics and sub-analyses
-
-
Scope of Application
-
Analyze wafer, field and sub-field induced aberrations.
-
Remove user-selected modeled wafer and field errors prior to calculation.
-
Multiple full-wafer and field models
-
Proprietary adaptive model engines;
-
Raw data, modeled, simulated and residual spatial analysis interface
-
Serially linked wafer, field and slit/scan model sequence.
-
model coefficient removal and simulator for “What If?” scenario investigations during tool setup
-
-
Application Specific
-
Automated precision and error budget calculation for metrology, exposure and process
-
Metrology tool characterization through automated error-budget calculations
-
Scatterometry and ellipsometric algorithm validation for breadth of validity, matching and precision.
-
Metrology feature and process correlations with variable covariance matrices.
-
Focus, dose-latitude and process-window analyses.
-
Multiple graphics for evaluation of dose, focus and process window.
-
User control over process window limits, working point, graphic selection and display format, features and fields sites included in the analysis.
-
Best Focus field mapping from critical features
-
Depth-of-Focus, full-field mapping
-
Optimized feature uniformity mapping
-
Reticle signature estimation
-
Exposure dose uniformity mapping
-
-
Experimental Setup
-
Automated exposure layout and tool configuration with the Weir layout interface.
-
Exposure tool library for storage of tool characteristics.
-
-
General
-
Object-oriented structure with point-and-click graphics and culling.
-
Drill down data visualization and data-subset modeling
-
Advanced graphics including histograms, vector, range, XYplot , contour, bulls-eye, box-plots, population density and 3D plotting.
-
See the Software Requirements Specification for this product for more detail.
System Recommendations
Weir PW© is a compiled application with a full object oriented, mouse-interactive interface. Drill down graphics and spreadsheet analysis supported. Functional on Windows 2000, XP etc.. Microsoft Excel© is required.
Recommended
hardware:
-
Pentium IV,1.2 GHz,
-
256 Meg of RAM,
-
1024x768 Graphic Monitor and 30 M free space on disk for programs.
-
Data storage may require up to 6.0 Gigabytes additional.
ã Copyright 2005,2006 TEA Systems Corporation 65 Schlossburg St., Alburtis, PA 18011 All rights reserved. Legal