Weir DM
Process Window Feature Design using Weir DM Batch processing
See Also: Weir DM Brochure
Related Tutorials: Weir DM Macro Setup, BARC Film Evaluations
Applications: Process comparison, Process window setup, OPC or Phase Shift feature design evaluation,
Process Control tuning , yield enhancement, reticle process window derivation
reticle qualification, OPC characterization, dose mapping,
improved process window selection.
Other tutorials in the user's section: White Paper Tutorials
Contact TEA Systems for a Weir Demonstration or Logon
Many analyses require multiple data files to
be analyzed and their results compared. Analysis complexity in these situations
rises very quickly and the work involved can be tedious and repetitive. Under
these conditions mistakes are often made and speed compromises result in a less
than optimal setup.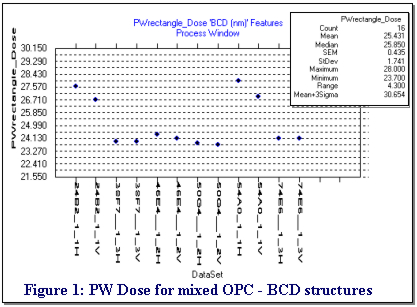
Weir DM is typically used for periodic, repetitive analysis of toolsets for process stability. Results are summarized in a temporal trend chart.
Weir DM software can also be used to analysis a "batch" or set of related data files. The analysis results of each file are displayed on screen in the macro-defined graphic and trend variables are entered into the trend chart section of the Weir Macro. The user now has full access to both the individual results as well as the comparative trend results of the entire data family. All of the analysis and data gathering is automatic and can be performed offline.
This tutorial uses a series of data sets that characterize the process window behavior of several phase-shift features structured under different periodic loading conditions for five sites on a field. The technique shown here can be applied to any overlay, registration, focus, thermal or other Weir Macro metric set.
Keywords: Dose Response, algorithm, Batch, automation, trend chart, html, OPC, Optical Proximity Correction, Phase, FEM, Focus-Exposure Matrix, duty cycle, period, IsoFocal Dose, IsoFocal Bias, IsoFocal Feature Size, Isolated-Dense, IsoDense, bias, Bossung, Best Focus, Best Dose, IFD, DoF, Depth-of-Focus, process characterization, process response, Process Window, Reticle design, process control
Table of Contents
Running the Weir DM Batch Analysis
Process Window Extended Characterization
Tables Listed
Introduction
A new design,
shrink or reticle set arrives. Your next job is to determine the performance of
multiple features designed on different pitches, orientations or with
different out-riggers and neighbor sizes. Weir DM can be used to both automate
and reduce the time and effort needed to calculate and analyze the critical
relationships critical to your needs. 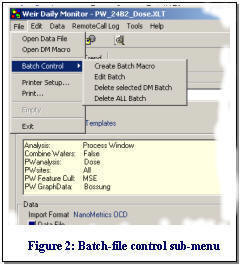
Weir DM analyses function with any metrology data and for many different applications. This tutorial addresses a process window investigation to determine Bottom Critical Dimension "BCD" response for different sites and variable characteristics over five sites in an exposure field. Data is imported and converted into a standard-format Microsoft Excel Workbook and analyzed. Results are then summarized in trend-chart like datasheets for easy interpretation as shown in figure 1.
We could use any overly, SEM, Focus, test or ECD data sets with this method. In this example we will concentrate on an initial process window setup and will show you how to:
-
Specify a Weir Template for calculating process window variables using the Dose Response algorithm.
-
Select a set of data files for analysis using the Weir DM Batch Processing toolset.
-
Run the analysis with just "one click" of the mouse.
-
View the results of the analysis for both Raw Data and Process Window Performance using the Weir DM trend charts.
One license of Weir DM is included with every purchase of
Weir PW or Weir PSFM. Weir DMA can be used to automate the calling sequence
from other process control or factory automation software. Outputs summaries
can be sent to text, Microsoft Excel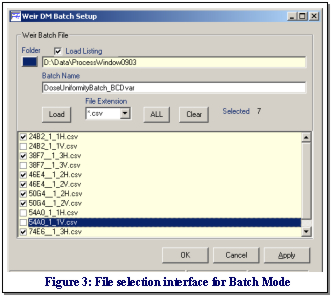 Worksheet or web page (html) formats.
Batch-File Analysis Setup
Access Weir DM either directly using the shortcut provided in your program menu or through the "Tools/Weir Daily Monitor" menu selection in the Weir Main interface.
Weir DM can be run using the single-file selector at the bottom of the interface. However, to run a multiple of jobs automatically, select the "Create Batch Macro" command from the File menu as shown in figure #2. The file selection interface shown in figure #3 will then be presented with it's default location positioned in the data source folder specified by the Weir Macro template.
You can change the data folder by either typing in a new location in the first window or by selecting the browse-folder-button immediately to this fields left. If the "Load-Listing" checkbox is selected, the files in the directory will be automatically loaded into the file-selection window as shown.
Enter any name for the batch. This name will then be used
to identify the batch selection in the batch-combo that appears as shown in
figure 5. You can specify any number of "batch" files, their names and file-selections
will be stored in the Weir Macro workbook worksheet shown in figure 4.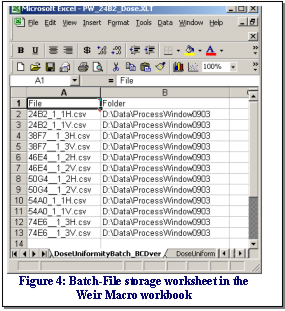
The drop-down "File Extension" selection is used to automatically filter out files by type. Select any one of the extensions in the drop-down list or type in an extension or wild card. For example, "*.*" will list ALL files in the directory.
After the listing of files is fully populated select the data you want to analyze by using the left mouse-button to check the box immediately to the left of the file name. The number of items currently selected appears in the "Selected" label on the right-side of the interface.
Use the "All" command to select or deselect all of the entries. Any raw format file or Weir Standard Format workbook can be selected for this list.
Use the "Clear" command to deselect all entries.
Press the "Apply" command when you are satisfied with the selection and exit the interface by using the "ok" button.
All files selected in this interface will be analyzed using the methods and procedures of the Weir DM Macro workbook in which they are stored. The format of a typical batch-storage list is shown in figure 4.
Running the Weir DM Batch Analysis
Figure 4 shows that a total of 12 data files were selected for measurement. The data classifiers "24B2, 38F7, 46E4 etc" designate different 80 nm structure designs that vary in Optical Proximity Correction (OPC) or basic Phase Structure Design. All data sets measure Bottom Critical Dimension (BCD) structures that are exposed on a focus-exposure matrix (FEM) whose layout is defined and stored in the Weir Macro workbook, in this case "PW_24B2_Dose.XLT", as seen in figure 5. The last part of each dataset name contains the feature orientation as vertical ("V") or horizontal ("H"). Feature duty cycle or periodicity is defined in the naming just before this moniker as 1_1 ( 1-to-1) , 1_3 (1-to-3) etc.
Figure 5 displays the primary run interface for the Weir DM
and Weir DMA software. If the macros selected contains any batch files, the
"Batch Control" frame will become visible along with it's drop-down list of
batches.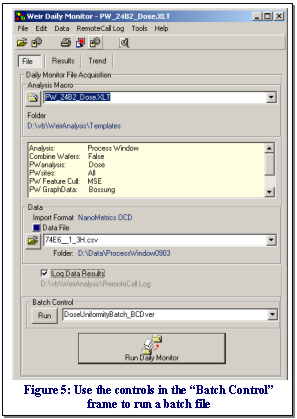
To run a Batch Analysis, select the batch-file from the drop-down listing and use the "Run" command button located immediately to it's left.
Note: You can still run a single data set in this mode by selecting a file in the "Data File" combo and using the "Run Daily Monitor" command button.
In our Weir Macro of this example, we've selected a Dose analysis for a Bottom Critical Dimension (BCD) feature. We are targeting an 80 nanometer (nm) feature size with control limits at +/-10% of target size. Five sites on each field have been measured and each field represents a different point in a full focus-exposure (FEM) matrix.
Each of the data files in figure 4 represents an 80 nm BCD
feature with different loading or feature size. For instance, a "1_1H"
designation represents a Horizontal feature on a 1:1 duty cycle (80 nm
feature, 80 nm space). A "1_3V" designator represents data for a Vertical
feature in a 1:3 duty cycle (80 nm feature, 240 nm space). The first 4 letters
of the designators represent other pattern structures, the details of which
are unimportant for this example. In your own experiments, you may select any
combination of designator and feature type.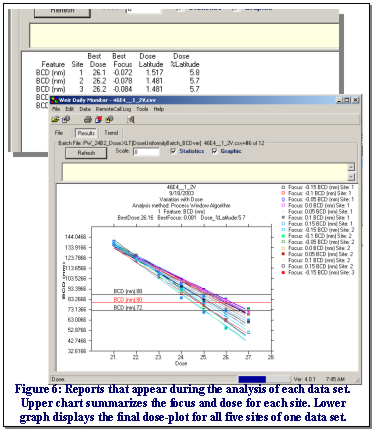
While running, Weir DM will automatically switch to the "Results" tab and display interim analysis data and graphs, some examples of which are shown in figure 6. Each set of graphs reflects the results of the current data set.
Progress in the batch file is shown in the "gas-gauge" progress bar at the bottom of the screen in figure 6 and in the frame listing at the top, immediately above the "Refresh" button. In this figure the analysis is on data set #6 of 12. The upper tabular report lists the results for each site. For this analysis the results summarize the best dose and focus as well as the calculated dose latitude.
If you "check" the "Log Data Results" box as shown in
figure 5, then the analysis status and it's results will be logged into the
user-specified system log. This is the same logging that occurs during a Weir
DMA is run and it can be viewed by selecting the "RemoteCallLog/View Log" menu call
from the interface menus. A sample log can be viewed at this
link.
Raw Data Performance
The summary data for each dataset or lot is stored in the Weir Macro workbook in a worksheet whose name contains "TC_" followed by the name as the variable; that is, for our "BCD(nm)" variable in the example here the worksheet is named "TC_BCD(nm)".
Select the "Trend" tab to access all of the trend charts in the Weir Macro. Weir DM defaults to the "Raw Data" trend charts when first used as shown in figure 7. To view a different variable simply select the variable tab at the top of the chart. These "tracked" variables were selected by the user during creation of the Weir DM Macro and can be changed by directly editing the "TemplateHeader" spreadsheet or by re-editing the Weir Macro.
Two command buttons in the upper left of the screen, "Data" and "Display", allow the user to select and control the variables available to the chart displays. Figure 7 shows the "Display" selection controls.
Both the "Statistics" and "Graphic" check boxes are selected so the plot in this figure displays both the trend chart and associated statistics for the entries. The "Y axis gridlines" checkbox controls whether or not the "Y-axis" grid lines are shown on the trend plot. Note; you could also display these grid lines by right-clicking on the trendchart to edit the graph-edit interface.
The "Sort by DataSet" check-box controls whether the data is presented in the order it was analyzed (one point per analysis) or by dataset name with the data points grouped.
The "Abscissa" options buttons control whether the "Date" is displayed on the trend-chart, as is the classic format for a chart of this type, or the dataset name. Our example however must have the data sorted by the name of the dataset since the feature types are sorted by their dataset.
The raw "Range" of each data set's BCD values across the FEM is shown in figure 7. Here we can see the "38F7" structure has a significantly larger range of values for the 1:3 loading condition. The mean Range value of all structures is 106.118 nm however the graph suggests a 96 nm average for most of the features.
Trend charts are interactive with the mouse as shown by the yellow message that appeared over the 3rd data point in figure 7 indicating the points value and location on the graph. You can also view the data of the graph by selecting the "Data/View Data" menu item or by clicking on the last button in the button bar at the top of the interface.
Graphics can be captured for either the graph itself or the full interface, as shown in figure 7, by using the "Edit" menu commands or the 4th and 5th buttons on the button-bar. Hover the mouse over each button to see it's function.
.
Process Window Data Performance
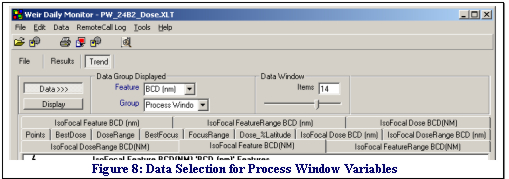
Select the "Data" command button to view the data control options for the analysis as shown in figure 8. The controls in this segment include those for the "Data Group Displayed" and those for the "Data Window".
The "Data Group Displayed" controls allow selection
of the
"Feature" or data variable as well as the data group. The only "Feature" in this
example is the "BCD(nm)" variable since we only selected one variable
during definition of the Weir
Macro. The data Group will be either "Raw Data" or the modeled variables of the
"Process Window". In figure 8 we selected the "Process Window" group and the
variable tabs associated with it now appear as shown in figure 8. The variable tabs that appear
will depend upon the variables selected for inclusion in the trend charts during
definition of the Weir Macro.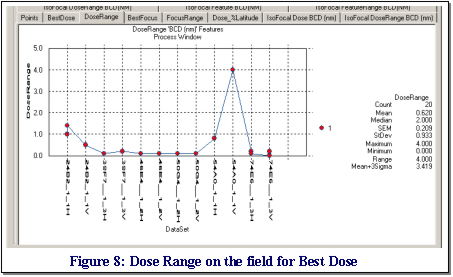 See Table 1 for
a listing of the variables associated with each type of process window analysis.
See Table 1 for
a listing of the variables associated with each type of process window analysis.
The "Data Window" defines the number of data points or "items" that will be visible in the graph. Our example only has 12 data points however if you are using a trend chart with several hundred or thousand data points then this control allows you to sub-sample the number of points displayed. The slider control immediately below the "items" field in figure 8 will adjust which subset of items are display in the graph. To display the earliest data, move the slider to the left. The most recent data can be viewed if the slider is moved all the way to the right.
In Figure 1 we saw the Best Dose as calculated for each target type. Figure 8 has calculated the "Dose Range" or range of best-dose values for the five sites of each field. Notice that the 24B2_1_1H entry and last two data points contain data that had been run earlier at a slightly different BCD target value. The total number of points is therefore 20 in this figure rather than 12. The higher 4 mj/cm2 dose range value of the 54A0_1_1V feature suggests the structure will be uncontrollable at the 80 nm target size.
We right-clicked to edited the graph of figure 8 to both
reduce the ordinate's display to only one significant value after the decimal
and to include grid lines at each abscissa data point. The color and size of the
data points in the series were also increased and connected.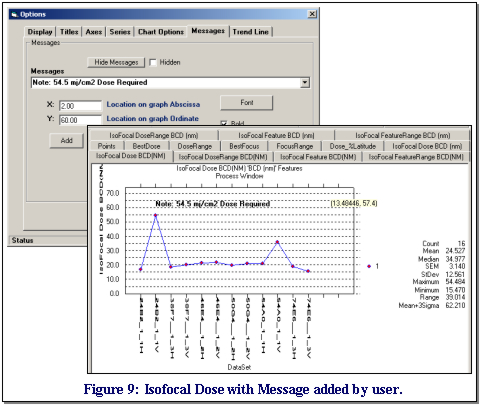
 The
IsoFocal Dose for each feature response is plotted in figure 9. The
IsoFocal dose is shown to be stable at approximately 20 mj for most of the
features. This implies that an 80 nm feature requires an IsoFocal Bias of 4 mj/cm2 for these features.
The
IsoFocal Dose for each feature response is plotted in figure 9. The
IsoFocal dose is shown to be stable at approximately 20 mj for most of the
features. This implies that an 80 nm feature requires an IsoFocal Bias of 4 mj/cm2 for these features.
Two features show problems and we right-clicked on the graph to enter a message using the graph editor shown in the upper left of figure 9. To find the value of the IsoFocal Dose for the 2nd data point (24B2_1_1V) we simply hovered the mouse over the site and then added the displayed valued into the graph's message box.
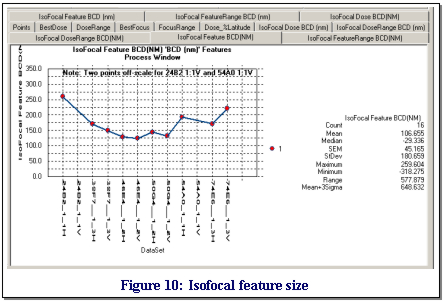
The Isofocal Feature Size associated with each IsoFocal dose is plotted in figure 10. Notice that the two "problem" features, 24B2_1_1V & 74E6_1_3H, are off the range of the graph. The remaining features plot from a natural size of 250 nm to about 125 nm for the majority of the features. This suggests the optimum results for this reticle and process would employ a process window of about 130 nm.
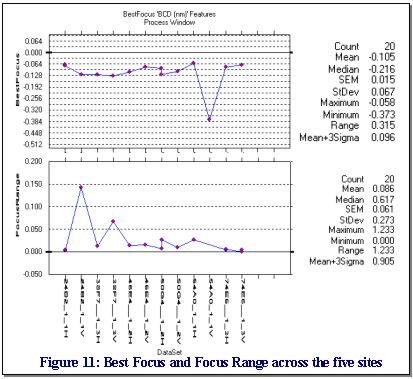
The Best Focus calculated for an 80 nm feature target size is shown in figure 11. The figure also shows the range of Best Focus values for the five field sites measured for each feature type. Graphs such as these are good for both process setup and for determining the true isolated-dense (IsoDense) bias of a feature type since we can evaluate the features at multiple sites in the field rather than concentrating on a single or "average" site.
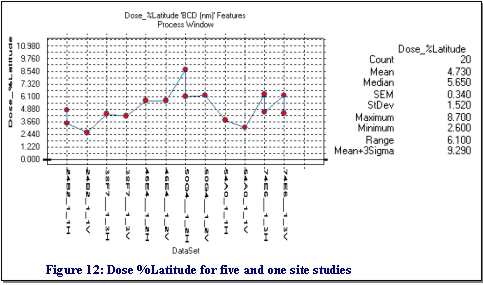
Dose or Exposure Latitude (EL or EL%) can vary significantly depending upon feature structure and is one of the better metrics for a good study of pattern stability with process variation. Figure 12 shows the 80 nm target size yielding approximately a 4.7% range in Dose Latitude. Notice that there are 20 data points in this graph; the extra data points are from a test sequence where only one point per field, rather than five, was measured. As expected, the single point resulted in higher EL% than seen when five points are measured for each field. Four of the structures show this sensitivity.
Process Window Setup - Extended Characterizations
Thus far we've examined some of the information that can be gained from a Dose or Exposure analysis of the process window for a series of features. Weir DM can also extend this technique to the Focus, IsoFocal, Dose at Best Focus and Process Window analyses with just as much ease. Application of these other methods will repeat some calculations, such as the Best Dose and Best Focus metrics, but will also add additional viewpoints and interactions to the comparison as shown in table 1.
|
Table 1: Trend Charts Statistics based upon analysis type IFD = IntraField Deviation DoF = Depth of Focus |
|||||
| Focus | Dose | Dose @ Best Focus | Process Window | ||
| Points | Points | Points | Points | ||
| IsoFocal Dose | IsoFocal Dose | IsoFocal Dose | IsoFocal Dose | ||
| IsoFocal DoseRange | IsoFocal DoseRange | IsoFocal DoseRange | IsoFocal DoseRange | ||
| IsoFocal Feature | IsoFocal Feature | IsoFocal Feature | IsoFocal Feature | ||
| IsoFocal FeatureRange | IsoFocal FeatureRange | IsoFocal FeatureRange | IsoFocal FeatureRange | ||
| Best Focus | Best Focus | Best Focus | PWrectangle Focus | ||
| Best Dose | Best Dose | Best Dose | PWrectange DoF | ||
| Feature Size | Dose Range | Dose Range | PWrectangle Dose | ||
| DoF | Focus Range | Focus Range | PWrectangle DoseLat | ||
| Mean IFD (feature size) | Dose %Latitude | Dose %Latitude | PWrectangle %DoseLat | ||
| Best Focus IFD | PWellipse Focus | ||||
| DoF IFD | PWellipse DoF | ||||
| PWellipse Dose | |||||
| PWellipse DoseLat | |||||
| PWellipse %DoseLat | |||||
Reticle and Process Response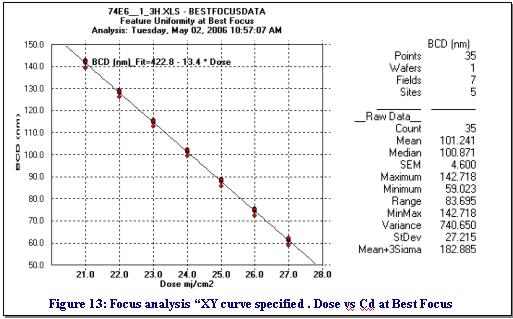
The variables for the Dose @ Best Focus analysis are the same as those listed for Dose. The critical difference in the results is that the Focus analysis must first be performed to calculate the optimum focus for each site on the field. The feature size errors, due to local defocus, are then removed from the analysis and a Dose analysis is performed on the residuals.
The power of this approach for process characterization is that the feature perturbations introduced by the lens, reticle bowing, scan and feature construction are removed from the response and a true Process Response for the photoresist, ARC or film stack can be calculated with improved accuracy.
The next discussion will review some results from a macros analysis of the data using the "Dose @ BestFocus" method. For this analysis the BCD(nm) size response was compared against dose for five sites on each field after the focus perturbations were removed. The data response curve for the 74E6_1_3H feature, a 1:3 period on a Horizontal feature, is shown in figure 13.
The graph of figure 13 appears after the analysis of each
new dataset and is defined in the Weir Macro. The
variables calculated from this analysis are then entered into the trend charts
for the variable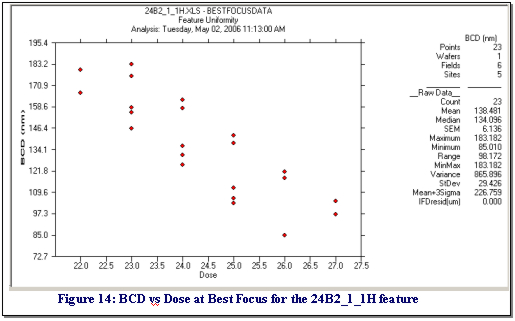 .
.
To generate the trend curve, we used the mouse to "right-click" and edit this graphic. We then used the controls on the "Trend Line" tab to fit the 1st order curve to the data and illustrate the clean response to dose obtained by this method. Variations from site-to-site at each dose represent the feature-size offsets of the sites on the reticle.
Contrast figure 13 with the results obtained for the 24B2_1_1H feature, a 1:1 period, shown in figure 14. Here the process response for each site is still linear but the site-to-site variation on the reticle is large and the overall range of acceptable response to dose is small. This is a design or reticle manufacture problem.
Feature Size Response at Best Focus & Dose
A focus response analysis macro applied to the data results in the charts of figure 15 for the Feature Size (top graph) and Mean_IFD (bottom graph) response. The feature-size metric is the size of the feature at Best Focus for the entire field, not each site, and at the dose value for the field that achieves the nearest target feature size. You can review the dose values in figure 1. Since our target BCD size is 80 nm +/-10%, we should expect the curve in the top chart of figure 15 to be a flat line at 80 nm for a stable process target. However, several of these points are shown to average above or below the 80 nm target.
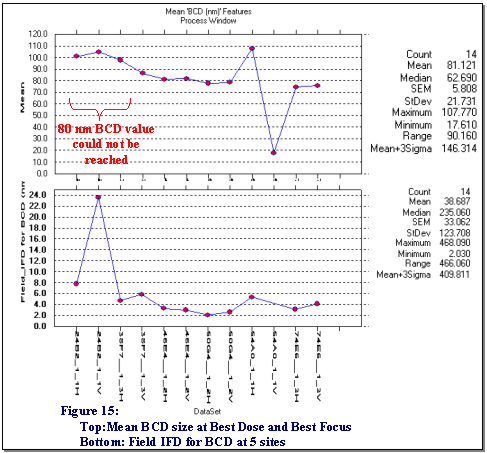
The Weir algorithm will interpolate between dose settings however it does not extrapolate beyond the range of the experiment. Extrapolation is dangerous because of the potential nonlinear response that can occur is such regions. As a result, we see the first 3 patterns in figure 13 do not reach the 80 nm target range within the dose range of the data. Likewise, the 54A0 H&V patterns, on the right size of the curve, also do not reach the target size and in fact respond quite differently depending upon their orientation. These results are not too surprising since the analysis is pushing an IsoFocal Bias of 4 mj/cm2 for the target size. This technique highlights the robustness of the feature designs for production stability.
While the top curve of figure 15 yields the average feature size, the bottom chart shows the range of feature sizes across the field, or IFD, for the five sites measured. The process will therefore experience a 2 to 4 nm variation in feature size for the 1:2 and 1:3 periodic structures.
|
|
Report Publishing to "html" pages on the web
Any of the Weir Reports are in Microsoft Excel spreadsheet format. This means you can publish modify, annotate and publish them to any web site by the the "File/SaveAs" menu command and selecting the "html" format. To add a graph to the report simply use the "Edit/Copy graphic" menu command and then past it into the report spreadsheet and then SaveAs HTML format.
Interrupting Processing
-
The "ESC" key will interrupt any processing if it is held depressed.
-
Weir Reports can be saved to any website. To save the report, open it's spreadsheet in Excel and select the "File/SaveAs" menu. When the pop-up interface appears, select the "Web (htm,html)" format.
Graph Customization
-
Graphs are easily copied using the Edit Menu selections, the button bar and by boxing-in a section of any plot with the mouse.
-
To edit titles, rescale graphs, and add box-plots, trend-lines and fitted curves, right click on the graph and use the Graphic-Editor interface.
SpreadSheet Control
-
A "Spreadsheet" menu is located near the top right-hand corner of the Weir program interfaces. It will be listed as the name of the loaded Weir Workbook. The menu shown in figure 3 is using the name "KLA_SAMPLE.XLS".
-
Clicking on any spreadsheet menu will bring it to the forefront in the Excel Workbook.
-
Selecting the "Delete Worksheet" submenu will open an interface that will interactively allow multiple worksheets to be deleted from the workbook.
-
An "Index" worksheet positioned at the 3rd tab of the Weir Data workbook lists and links all of the worksheets created for data, reports and analysis summaries.
TEA Systems
TEA Systems offers products to model films, photomasks, wafers, feature profiles, process and lens data for characterization and setup of semiconductor design, simulators, tools and the process.
TEA Systems, a privately held corporation since 1988, specializes in advanced, intelligent modeling of the semiconductor process and toolset. Products from TEA allow the user to decouple process, tool and random perturbations for enhanced process setup & control.
TEA Systems products include:
Weir PSFM: Full-wafer/field/scan analysis tool for FOCUS derived from proprietary defocus sensitive features.
Weir PW: Reticle/Full-wafer/field/scan analysis for any metrology with advanced process window capabilities for both wafer and photomask control.
LithoWorks PEB: A tool to link and correlate profile, film and critical element control to thermal reactions such as PEB and ChillPlate
Weir DMA: Macro Automation interface for Weir PSFM and Weir PW for external program calling, automated data gathering or one-button analysis of commonly used sequences. Includes data trending and web interface.
ã Copyright 2006 TEA Systems Corporation, All rights reserved. Legal
TEA Systems
Corp. | Tel: +1 610 682 4146
65 Schlossburg St., Alburtis, PA USA